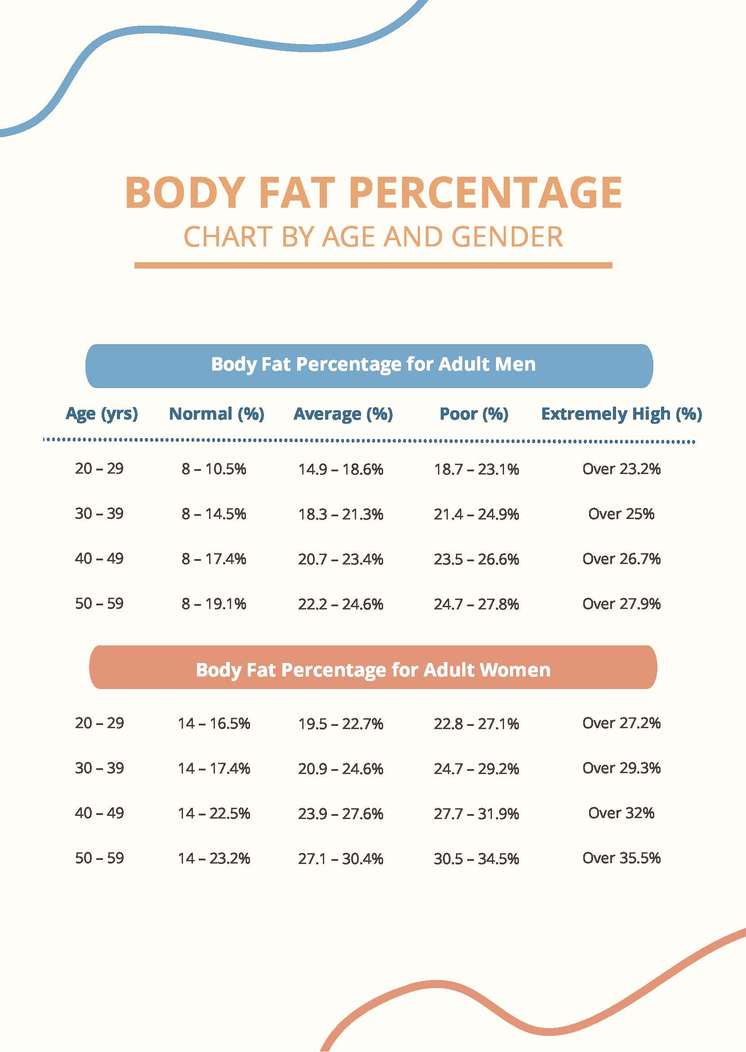
I have a folder on my desk labeled "bad charts." It contains body fat percentage reference tables from fitness magazines, gym walls, smartphone apps, and medical textbooks. Some show women at 15% as "athletic" with no age distinction. Some show men at 20% as "obese" regardless of whether they are twenty-five or sixty-five. Some use colors — green for good, yellow for caution, red for danger — as if body composition were a traffic light rather than a biological continuum. I keep the folder as a reminder of how badly this industry communicates the most basic facts about human bodies.
The truth is that body fat percentage changes with age in predictable, normal ways. It is not a sign of failure when a fifty-year-old has a higher body fat percentage than a twenty-year-old. It is biology. Hormones shift. Activity levels change. Metabolic rate declines. Muscle mass decreases. And the healthy range shifts upward accordingly. A chart that does not account for age is not a health chart. It is a fantasy.
Let me show you what the research actually says. The American College of Sports Medicine, the organization whose guidelines I follow as an ACSM EP-C, provides age-adjusted ranges based on large population studies. The World Health Organization uses similar data. The peer-reviewed literature on body composition across the lifespan — studies like Gallagher et al. 2000 and Chumlea et al. 2002 — consistently shows that essential fat stays constant while storage fat increases with age, and that the increase is normal, not pathological.
📊
Body Fat Percentage Estimator
Estimate your body fat percentage using the Navy method, YMCA method, or 3-site/7-site skinfold Jackson-Pollock equations. Free. Private. No data leaves your browser.
All data stays in your browser — we never see it.
Here is the honest reference chart:
| Age | Men Essential | Men Athletic | Men Healthy | Men Elevated |
|---|
| 20-29 | 2-5% | 6-13% | 14-23% | >24% |
| 30-39 | 2-5% | 7-14% | 15-24% | >25% |
| 40-49 | 2-5% | 8-15% | 16-25% | >26% |
| 50-59 | 2-5% | 9-16% | 17-26% | >27% |
| 60-69 | 2-5% | 10-17% | 18-27% | >28% |
| 70+ | 2-5% | 11-18% | 19-28% | >29% |
| Age | Women Essential | Women Athletic | Women Healthy | Women Elevated |
|---|
| 20-29 | 10-13% | 14-21% | 22-31% | >32% |
| 30-39 | 10-13% | 15-22% | 23-32% | >33% |
| 40-49 | 10-13% | 16-23% | 24-33% | >34% |
| 50-59 | 10-13% | 17-24% | 25-34% | >35% |
| 60-69 | 10-13% | 18-25% | 26-35% | >36% |
| 70+ | 10-13% | 19-26% | 27-36% | >37% |
Notice the pattern? For men, the healthy range shifts up by roughly one percentage point per decade. For women, the same. This is not because people are getting lazier. It is because body composition changes with age. After age thirty, testosterone declines in men and estrogen declines in women, both of which promote a shift from muscle to fat. Basal metabolic rate drops by about 2% to 3% per decade. Activity levels often decrease. And even with identical diet and exercise, older adults carry more body fat than younger adults. The chart reflects biology, not morality.
📊
Lean Body Mass Calculator
Calculate lean body mass from weight and body fat percentage. Includes bone mass estimate, organ mass reference ranges, and residual mass breakdown.
All data stays in your browser — we never see it.
The "athletic" category is particularly misunderstood. For young men, 6% to 13% represents the range seen in competitive endurance and strength athletes. For men over sixty, 11% to 18% is the comparable range. A sixty-five-year-old man at 16% body fat with high lean mass and good metabolic markers is just as athletic as a twenty-five-year-old at 10%. The percentage is higher, but the physiological reality is similar. Judging a sixty-five-year-old by a twenty-five-year-old's chart is like judging a marathon runner by a sprinter's standards. They are different sports.
The essential fat row is also critical. Men need 2% to 5% body fat for basic physiological function. Women need 10% to 13%. Below these levels, hormone production fails, bone density drops, and immune function is compromised. I have tested male bodybuilders who pushed to 4% for competition and spent months recovering their testosterone. I have tested female figure competitors at 8% who lost their menstrual cycles for a year. The pursuit of low numbers without regard for essential fat is dangerous at any age and catastrophic for long-term health.
📊
BMI vs Body Fat Analyzer
Compare BMI and body fat percentage side by side. Detect BMI false positives for athletes and flag normal weight obesity. Free. Private.
All data stays in your browser — we never see it.
I want to address the "elevated" category, because the word carries judgment that it should not. Being in the elevated range does not mean you are unhealthy. It means your body fat percentage is above the range associated with lowest metabolic risk for your age and sex. Many people in the elevated range are metabolically healthy, physically active, and functionally capable. The category is a statistical risk marker, not a moral verdict. Use it as information, not as a grade.
For practical use, I recommend testing your body fat every six to twelve months with a consistent method — DEXA, skinfold calipers, or even our free estimator under standardized conditions — and tracking your trend relative to these age-adjusted ranges. If you are thirty-five and your body fat is 24%, you are in the healthy range. If you are fifty-five and your body fat is 28%, you are also in the healthy range. The number is different. The category is the same. That is what an honest chart does.
What is a healthy body fat percentage for a 50-year-old man?
Approximately 17% to 26%. The healthy range shifts upward by about one percentage point per decade of age. A fifty-year-old at 20% body fat is in the same relative health category as a thirty-year-old at 18%.
Why do women have higher essential fat than men?
Because estrogen promotes subcutaneous fat storage, and female reproductive physiology requires a minimum fat reserve for hormone production, fertility, and bone health. Essential fat for women is 10% to 13%, compared to 2% to 5% for men.
Is it normal for body fat to increase with age?
Yes, within the ranges shown above. A one-percentage-point increase per decade is normal and expected due to hormonal changes, metabolic decline, and typical activity patterns. Increases beyond these ranges may indicate lifestyle factors that need attention.
Can I be healthy at a body fat percentage above the "healthy" range?
Yes. The ranges represent statistical averages, not absolute boundaries. Many people above the "healthy" range have excellent metabolic markers, high activity levels, and good functional capacity. The range is a guide, not a wall.
How do I know if my body fat is increasing from age or from lifestyle?
Track your trend over time with consistent measurement. If your body fat is increasing faster than one percentage point per decade, or if your waist circumference is growing independently of your weight, lifestyle factors — diet, activity, sleep, stress — are likely contributing.
I threw the bad charts in my folder into the recycling last week. I am tired of watching people judge their bodies by standards that ignore their age, their sex, and their individual physiology. Your body fat percentage is a number. It exists in a context. The context is your age, your activity, your health, and your goals. Any chart that ignores that context is not a health tool. It is a weapon.
Measure yourself against biology, not against a magazine cover.
— Emily Clarke