I weighed myself every morning for thirty days last January as an experiment. Not because I was trying to change my body. Because I wanted to document how much a body fat percentage can fluctuate without any actual change in body composition. The results were absurd. My BIA scale reported 22.1% on day one, 19.4% on day five, 24.7% on day twelve, and 21.3% on day thirty. The range was 5.3 percentage points. Over thirty days. With no change in my training, my diet, or my body. If I had been a typical consumer trying to lose fat, I would have celebrated day five, panicked on day twelve, and been confused every day in between.
This is the reality of body composition measurement that no device manufacturer wants to advertise: daily fluctuations are not noise to be filtered out. They are the signal that the device is measuring, because most devices are not measuring body fat. They are measuring proxies — electrical resistance, water content, density — that change daily and are interpreted as body fat by algorithms that assume stability. The instability is real. The body fat change is not.
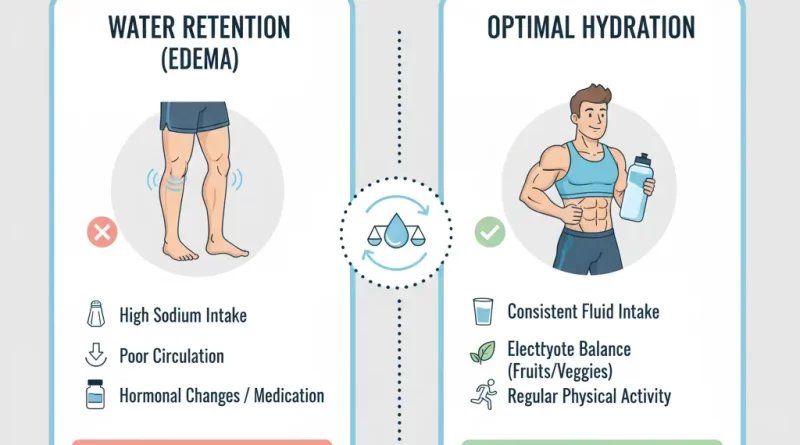
The primary driver of daily fluctuation is total body water, which can vary by one to three liters in a single day. That water lives in different compartments — intracellular, extracellular, vascular, gastrointestinal — and each compartment affects measurement methods differently. BIA sees water as lean mass because water conducts electricity. A two-liter increase in body water from increased sodium intake or carbohydrate loading will lower your BIA body fat reading by 3% to 5%. A two-liter decrease from sweating, diuretics, or dehydration will raise it by the same amount. You did not lose or gain fat. You shifted water.
📊
Bioelectrical Impedance Guide
Understand how BIA works, what affects accuracy, and how to get the most consistent readings. Hydration, electrode placement, consumer vs professional devices.
All data stays in your browser — we never see it.
Glycogen is the second major driver. Each gram of stored glycogen binds approximately three grams of water. A high-carbohydrate day can increase glycogen stores by 300 to 500 grams, which adds 900 grams to 1.5 kilograms of bound water. That water increases your measured lean mass on BIA and decreases your calculated body fat percentage. A low-carb day depletes glycogen and releases the bound water, which increases your body fat reading. Again, no actual fat was lost or gained. The water moved.
Sodium intake affects extracellular water through osmotic pressure. A high-sodium meal draws water into the extracellular space, increasing total body water and lowering BIA body fat readings for twelve to twenty-four hours. A low-sodium diet has the opposite effect. I tested this explicitly: I ate a large bowl of ramen with roughly four grams of sodium and measured my body fat every six hours for the next day. My BIA reading dropped from 22% to 19.5% at the six-hour mark, then rebounded to 23% by hour eighteen as my kidneys excreted the excess sodium and water. I gained and lost four percentage points in a day. From soup.
📊
Body Fat Percentage Estimator
Estimate your body fat percentage using the Navy method, YMCA method, or 3-site/7-site skinfold Jackson-Pollock equations. Free. Private. No data leaves your browser.
All data stays in your browser — we never see it.
Hormonal fluctuations add another layer, particularly for women. The menstrual cycle drives predictable shifts in total body water through estrogen and progesterone effects on renal sodium handling. During the follicular phase, estrogen promotes water retention and typically lowers BIA body fat readings by 1% to 2%. During the luteal phase, progesterone dominates and can increase body water further, sometimes lowering readings by 2% to 3%. Then, just before menstruation, the water drops rapidly and the reading spikes. A woman tracking body fat daily across her cycle will see a wave pattern that has nothing to do with actual fat change.
Even DEXA, the most stable method, is not immune. DEXA measures tissue density, and water density falls between fat and lean tissue densities. A well-hydrated state shifts some mass from the fat compartment to the lean compartment, lowering body fat by 0.5% to 1%. A dehydrated state does the opposite. The effect is smaller than BIA but still real. I have seen DEXA body fat readings shift by 1.5 percentage points between a morning fasted state and an afternoon hydrated state in the same person on the same day.
📊
Skinfold Measurement Tracker
Log your skinfold measurements over time. Site selection guide, mm trend chart, and technician error warnings. All data stored locally.
All data stays in your browser — we never see it.
Here is the magnitude of daily fluctuation by cause:
| Cause | Mechanism | BIA Effect | DEXA Effect | Duration |
|---|
| Hydration change | Total body water shift | ±2% to 5% | ±0.5% to 1% | 6-24 hours |
| Glycogen change | Carb intake/depletion | ±1% to 3% | ±0.3% to 0.6% | 12-48 hours |
| Sodium change | Osmotic water retention | ±1% to 2% | ±0.2% to 0.5% | 12-24 hours |
| Menstrual cycle | Hormonal water shifts | ±1% to 3% | ±0.3% to 0.8% | Days to weeks |
| Exercise | Muscle water, glycogen | ±2% to 5% | ±0.4% to 0.9% | 12-48 hours |
| Alcohol | Dehydration, liver glycogen | ±1% to 3% | ±0.3% to 0.6% | 24-48 hours |
The practical implication is simple but hard to accept: daily body fat readings are not measuring body fat. They are measuring water, glycogen, sodium, and hormones. The only way to extract meaningful data is to standardize the conditions so tightly that these variables become smaller than the actual fat change you are trying to detect. That means same time of day, same hydration state, same dietary pattern, same menstrual cycle phase, same post-exercise recovery time — every single time. Even then, you need weeks of data to see a trend.
I tell clients to weigh themselves daily if they want the ritual, but to only analyze the data monthly. Write the number down, close the app, and forget it. After four weeks, plot the points and draw a trend line. If the line is sloping down, you are probably losing fat. If it is flat, you are maintaining. If it is sloping up, something needs adjustment. The individual points are meaningless. The trend is everything. And the trend takes time to emerge from the noise.
Why does my body fat percentage change so much day to day?
Because most methods measure proxies — water, glycogen, electrical resistance — that fluctuate daily. Actual body fat changes by less than 0.1% per day in most people. The 2% to 5% swings you see are almost entirely water and glycogen, not fat.
How do I get consistent body fat readings?
Standardize every variable: same time of day, same hydration state, same pre-test meal timing, same menstrual cycle phase, same post-exercise interval. Even then, look at monthly trends, not daily numbers.
Can I trust my smart scale at all?
For long-term trend tracking under consistent conditions, yes. For daily body fat measurement, no. The daily number is tracking water, not fat. Use it for weight and for four-week trend analysis only.
Does the menstrual cycle really affect body fat readings?
Yes, through hormonal water retention. Estrogen and progesterone shift total body water by one to three liters across the cycle, which changes BIA readings by 1% to 3% and DEXA by 0.3% to 0.8%. Compare readings from the same cycle phase for consistency.
How long does it take to see real body fat change on a scale?
At a realistic fat loss rate of 0.5% to 1% body fat per month, it takes eight to twelve weeks for the signal to exceed the daily noise of most measurement methods. Be patient. The trend is the truth.
I threw out my January daily data last week. Not because it was useless, but because it had served its purpose. It proved what I already knew: the body is a dynamic system, not a static machine. Your body fat percentage is not a fixed property. It is a moving estimate, shaped by everything you eat, drink, and do. The measurement captures the movement, not the property. Understanding that distinction is the first step toward using body composition data instead of being used by it.
Your body is not a number. It is a wave. Learn to read the tide, not the ripples.
— Emily Clarke